
When I asked that question in front of an audience of export executives at the Grand Rendez-vous de l’Exportation, the response was unanimous.
“Raise your hand if you manage information in more than one country.”
Everyone raised their hand.
“Keep your hand raised if this information always reaches the right place at the right time.”
Everyone put their hands down.
—
—
This observation does not apply solely to exporters. It holds true for pharmaceutical companies that operate in multiple regulated markets, manufacturers that manage suppliers across three continents, and service organizations that operate in multiple provinces. As soon as a company manages information coming from more than one location, the same problem arises: the information exists, it is accessible, but it is never structured in a way that makes it useful when needed.
Think about your typical week. A relevant article found on LinkedIn on Tuesday morning, an email from an overseas partner on Thursday evening, an industry report downloaded and then forgotten in a folder. Each of these signals could have influenced a decision, a conversation, or a proposal. Most of the time, they have no impact because they arrive at the wrong time, in the wrong format, and reach the wrong person.
It’s not a technological issue. It’s not a lack of training. It’s a structural issue.
And that’s exactly what an automated monitoring workflow does—without having to overhaul your systems or hire another analyst.
The Myth of Total Preparation
Many executives tell me the same thing before they embark on automation: “We’ll do this when we’re ready.” When the data is clean. When the processes are documented. When the team is trained.
That moment never comes.
The good news is: you don’t have to be 100% ready to get started. You need a small, well-defined initial project. Then a second one. And a third. When planned sequentially and built on a solid foundation, these small projects come together to form a coherent, functional system that can be adapted to companies of any size.
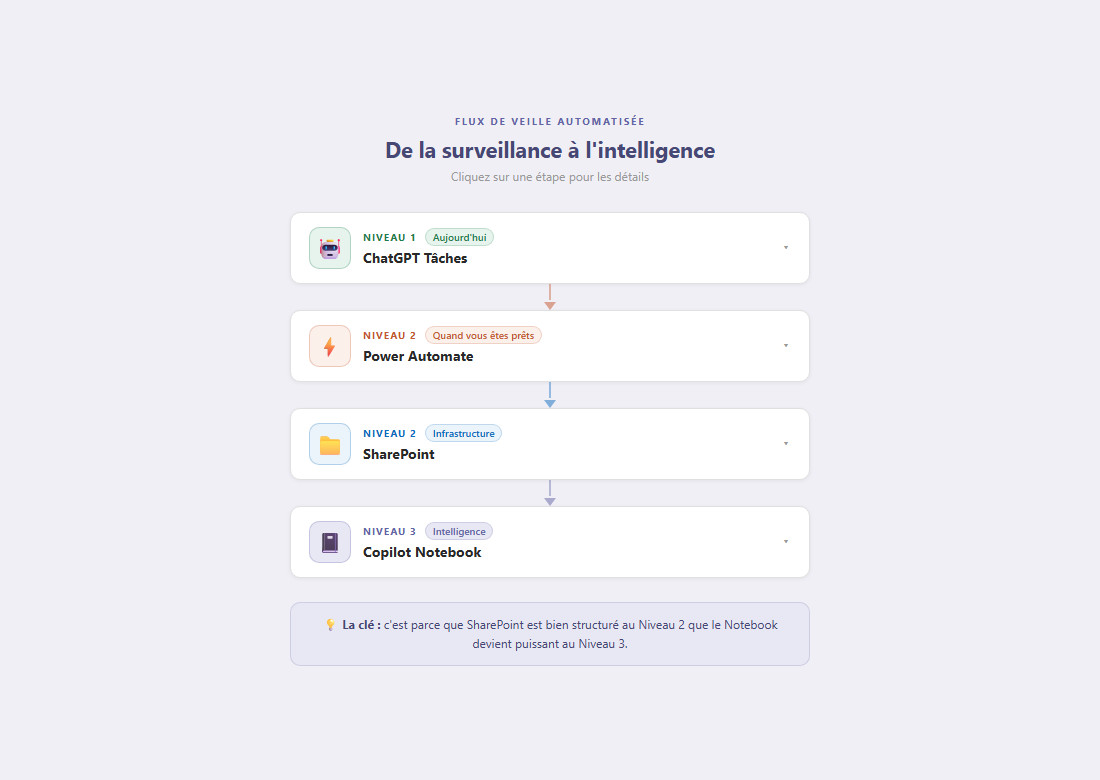
Automated market monitoring is a perfect example of this first project. Here’s how to build it, step by step.
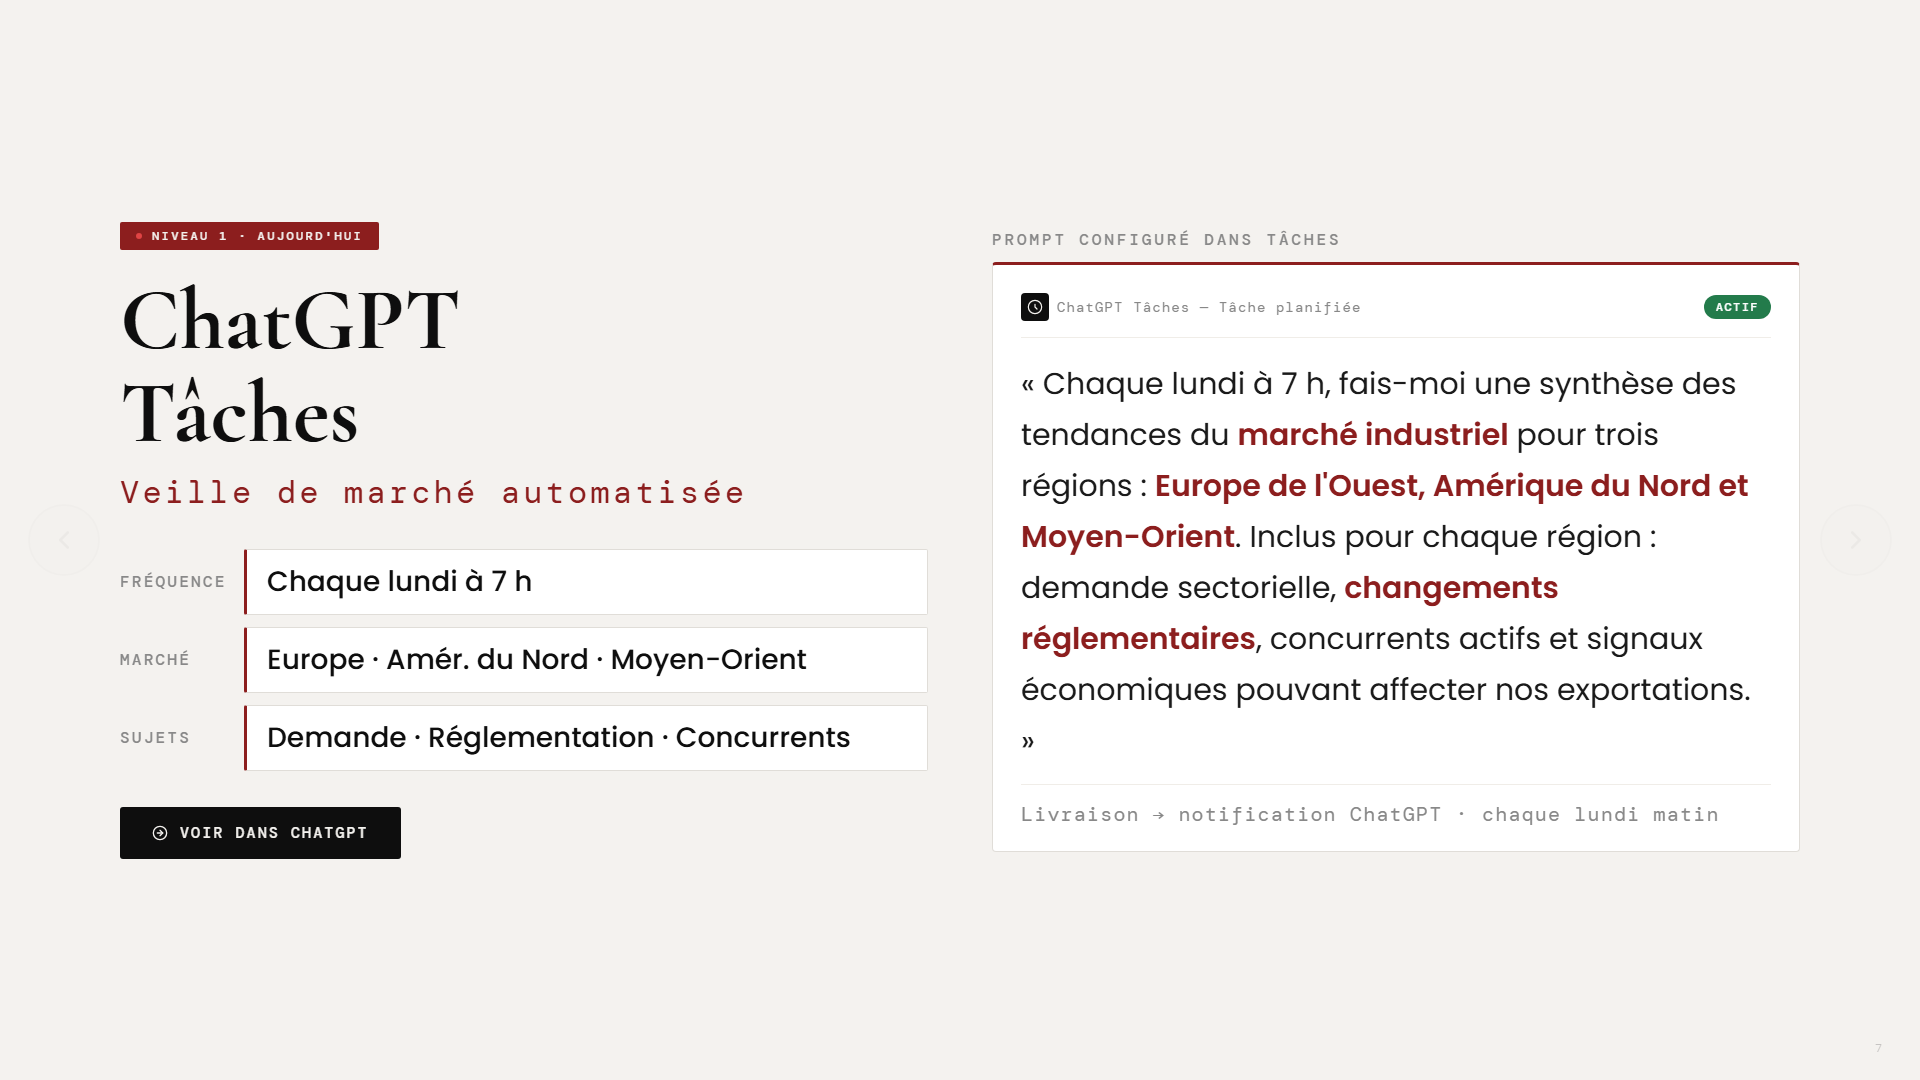
Level 1: ChatGPT Tasks — Get Started Today in 20 Minutes
The most accessible entry point. ChatGPT Tasks lets you schedule an automated summary to be delivered weekly, without any manual intervention.
Here is the type of prompt used during the presentation, tailored for an industrial exporter:
“Every Monday at 7 a.m., provide me with a summary of industrial market trends for three regions: Western Europe, North America, and the Middle East. For each region, include: sector-specific demand, regulatory changes, key competitors, and economic indicators that could affect our exports.”
—
—
This prompt is fully customizable. Change the markets, sectors, frequency, and language. The key is to start with something specific rather than a generic prompt. The clearer the context, the more useful the summary will be.
The result: every Monday morning, you’ll receive a notification with a structured summary of your markets—without having to open a single tab.
Level 2: Power Automate — Automate the workflow
ChatGPT Tasks is a great place to start. But as soon as you want to share information with multiple people, save it in a structured way, or use it for future analysis, you move on to Level 2: Microsoft Power Automate.
Here's how the process works:
- Scheduled trigger: Every Monday at 7 a.m., the feed activates automatically
- Generated via the ChatGPT API: the same prompt is sent, and the response is generated and structured by the AI
- Backup in SharePoint: Each summary is saved with metadata: date, contract, source, priority level
- Outlook Distribution: The summary is sent only to the right people—those who need to know
—
—
The key to this level is SharePoint’s structure. It’s not just a storage space. It’s the foundation that makes the subsequent levels possible. Every entry is dated, categorized, and prioritized. A history builds up. And it is precisely this history that becomes valuable at Level 3.
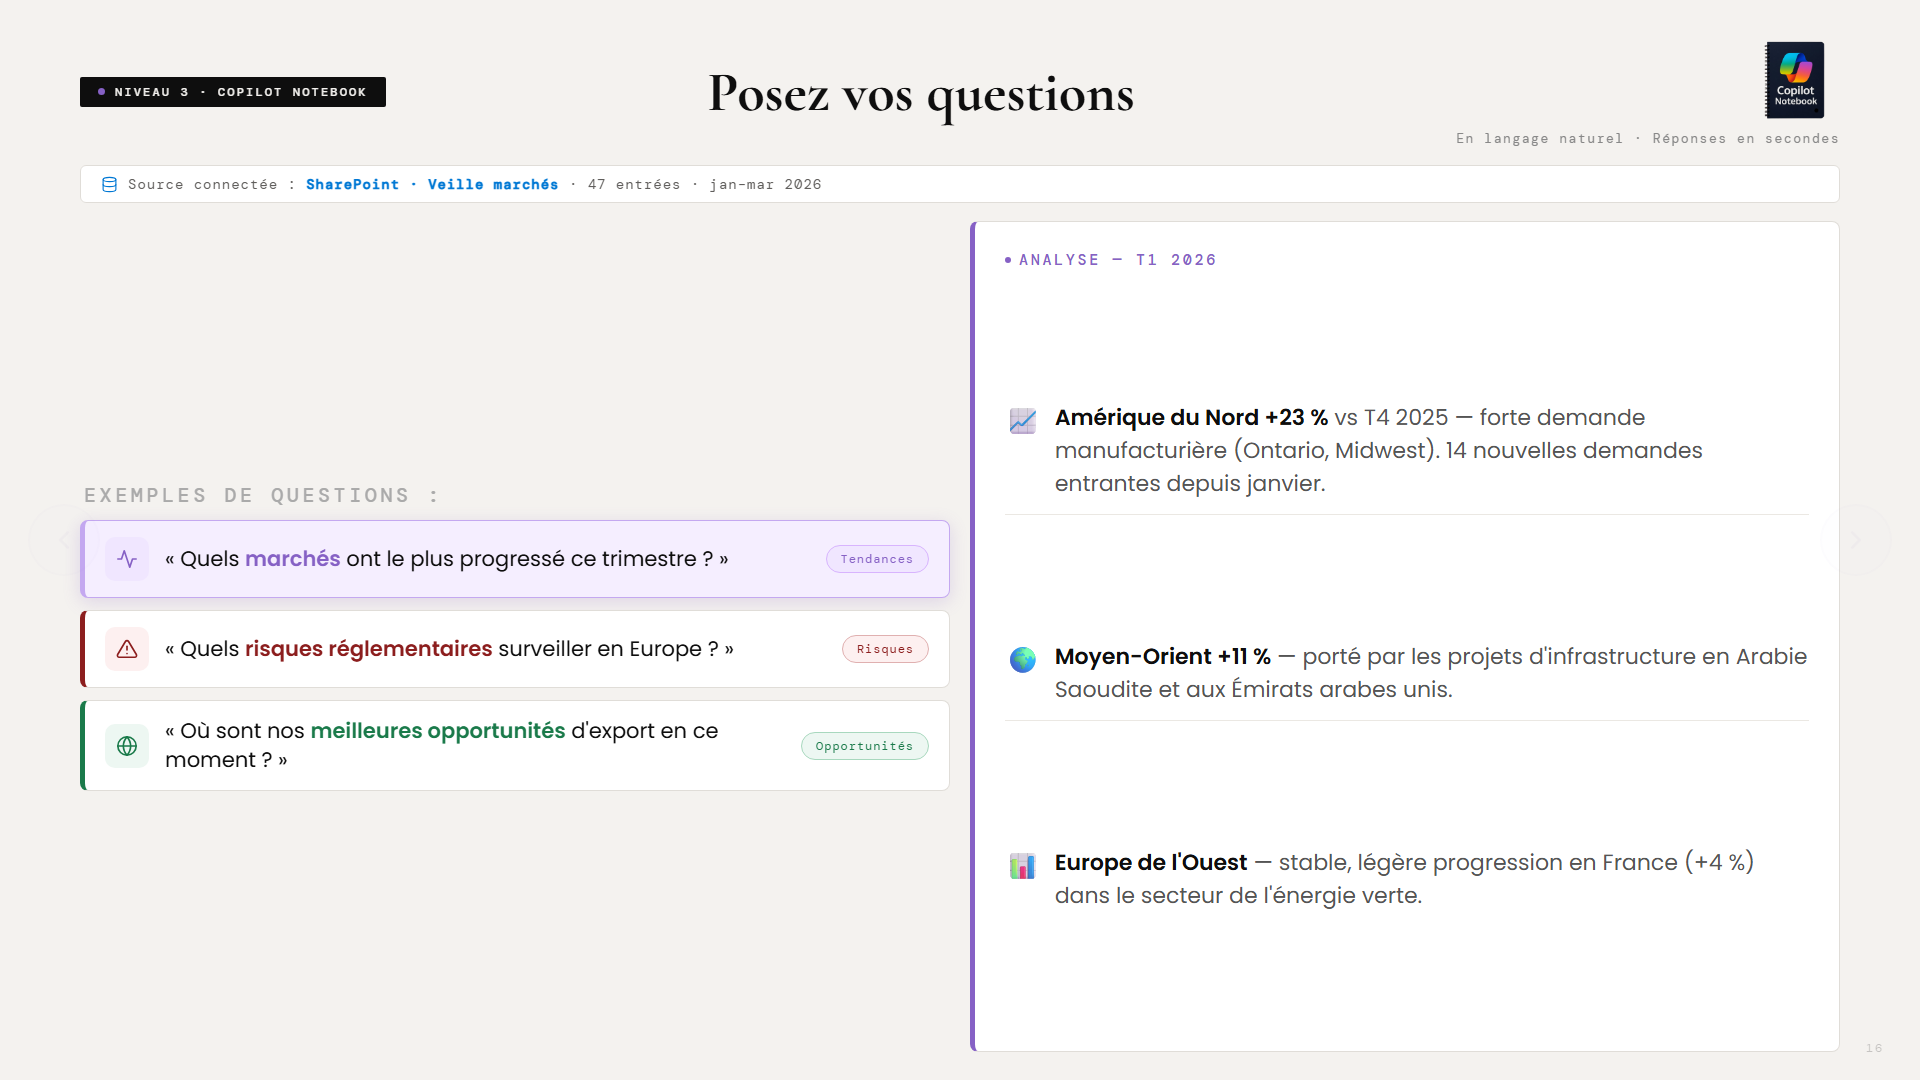
Level 3: Copilot Notebook — Tap into Your Own Business Intelligence
Once SharePoint contains 4, 8, or 12 weeks’ worth of structured summaries, you connect Microsoft Copilot Notebook to that library. Then you can start asking questions in natural language.
Questions such as:
- “Which markets have performed the best this quarter?”
- “What regulatory risks should we watch for in Europe over the next 90 days?”
- “Where are our best export opportunities right now?”
—
It’s no longer just a Google search. It’s no longer just a generic summary. It’s your own business intelligence, built up week by week, and accessible in seconds.
The difference is fundamental. A Google search gives you what’s public and popular. Copilot Notebook gives you what you’ve deemed relevant to your firm, in your markets, based on your criteria, over time. It’s the difference between reading the news and consulting your own organizational memory.
And because the data is stored in SharePoint with its own metadata, even older reports can be reprocessed if you change your analysis criteria. Did you decide in November to add a new market? The system can reanalyze the last six months of historical data using this new filter. No data is lost; everything is reusable.
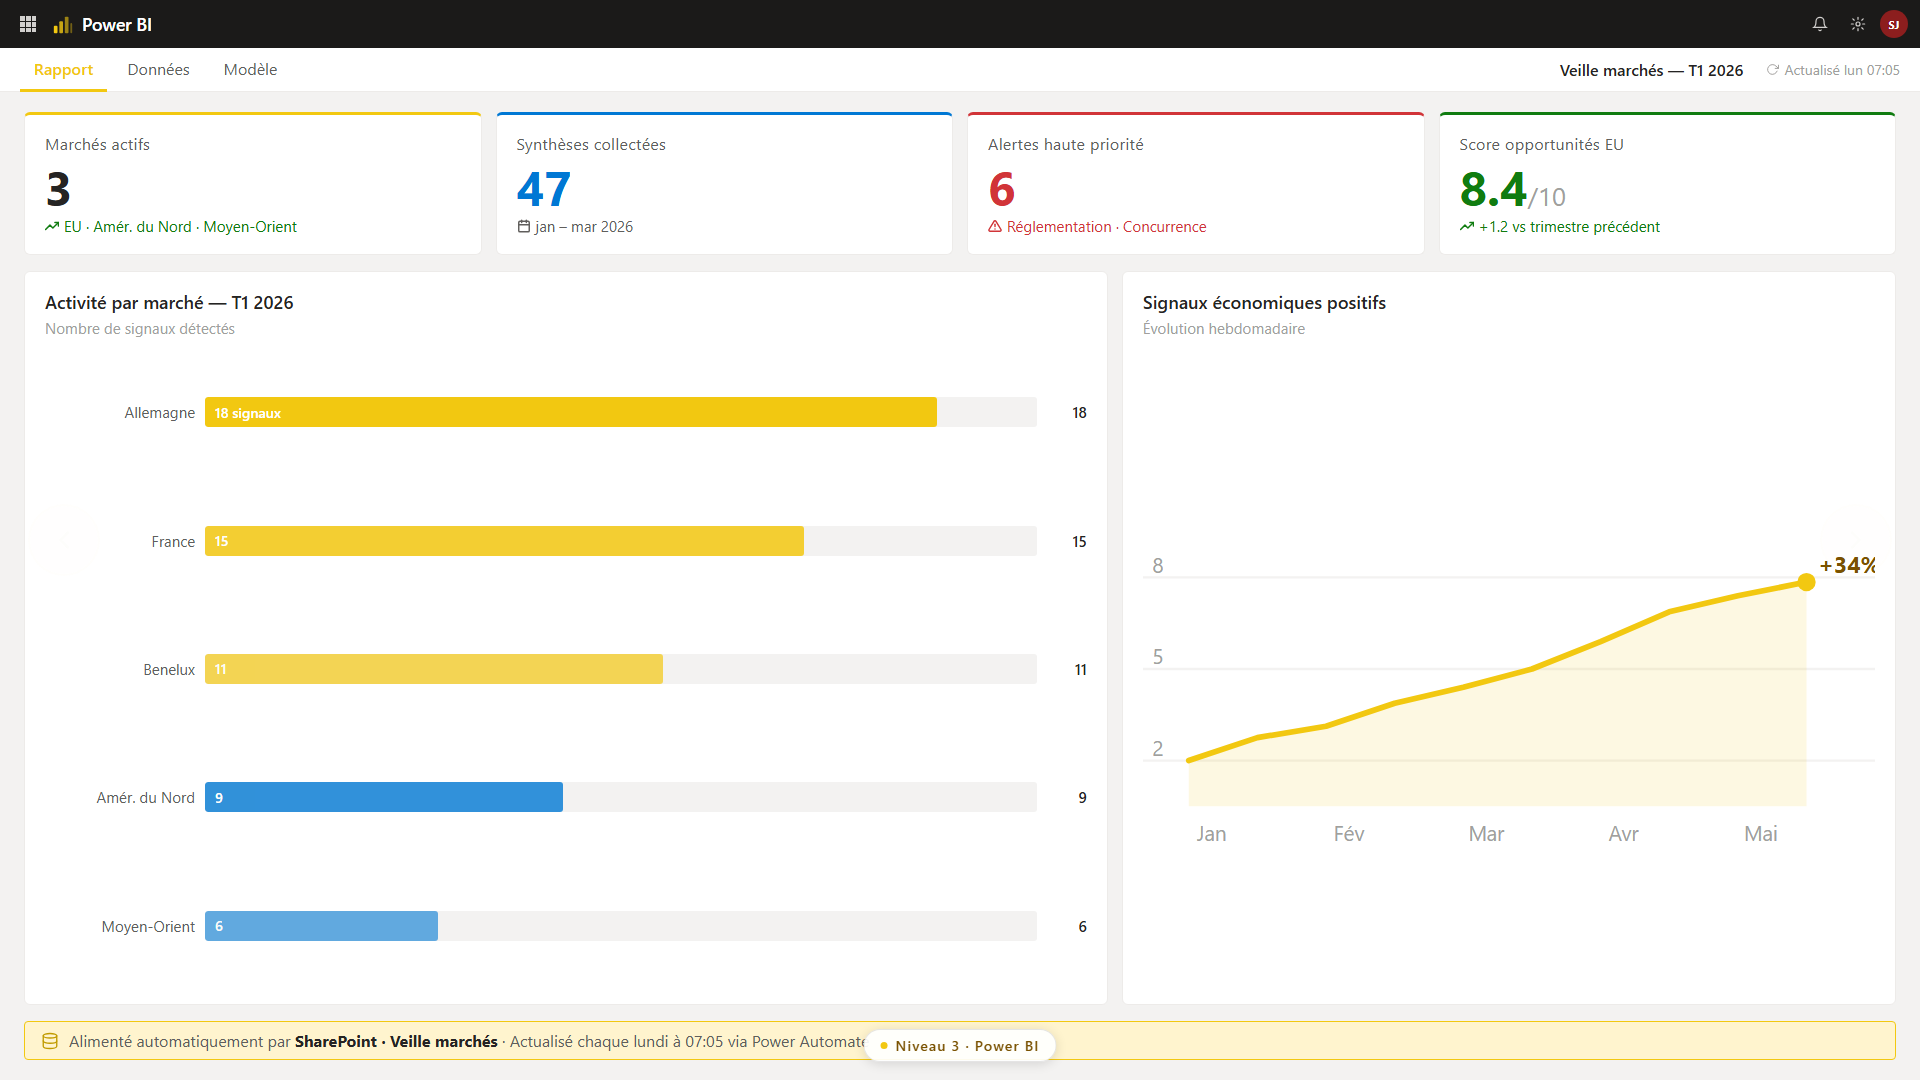
The result: a dashboard that updates automatically
At the end of the process, Power BI connects to the same SharePoint instance and generates automatic visualizations: opportunity score by market, number of detected signals, high-priority alerts, and weekly trends.
—
—
This dashboard does not require any manual updates. It reflects the current state of your markets as of the last time the feed was updated.
What you do on Monday morning
You don't need all five levels to get started. Here is the recommended sequence:
This week: Open ChatGPT, create a scheduled task with a prompt tailored to a specific market. Just one. Test it for two weeks. In a month: If the summary is helpful, create a Power Automate flow to automate the process and save it. Add a second market. In three months: Connect Copilot Notebook to your SharePoint library. Start asking questions about your own history. In six months: Power BI. Visualizations. A dashboard shared with your team.Each step stands on its own. Together, they form an intelligent system that gives your firm a structural edge over your competitors, who are still searching for information manually on Friday afternoons.
This principle applies far beyond exports
Market intelligence is the most concrete example for exporters, but the same system can be adapted to a wide range of other scenarios: regulatory monitoring in the pharmaceutical sector, tracking of construction bids, competitive intelligence in retail, and HR trend analysis for large organizations.
The principle is the same: organize data collection, automate processing, and make the history searchable. It doesn't matter how big your firm is.
What varies from one organization to another is the starting point and the pace of implementation. A small business with 15 employees can start with a single ChatGPT prompt targeting a single market and have something useful up and running by next Monday. An organization with 200 employees will build a multi-market Power Automate workflow with distribution by department. The logic is the same; the scale is different.
One thing remains true: those who organize their information today will make better decisions tomorrow. And those who wait until they’re “ready” will continue to search manually while their competitors move forward.
Download the full presentation given at the Grand Rendez-vous de l’Exportation:
Download the PDF presentation →Get a practical tip like this one every week:
Subscribe to the L’Architecte newsletter →Would you like to see how this type of system might work in your organization?
Chat with Steve →